
代码之家  ›  专栏  ›  技术社区  ›  thr

绘制科学数据的软件[关闭]

  •  5
  • thr  · 技术社区  · 16 年前

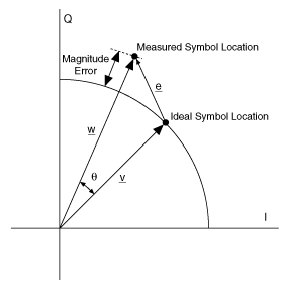
    我正在寻找一个用于绘制科学数据的软件,主要是矢量、坐标系和图表,例如:

    Example diagram

    9 回复  |  直到 9 年前
        1
  •  6
  •   teabot    16 年前
        2
  •  5
  •   Shane    16 年前

    R has excellent charting available ,尽管它需要您学习一些语法(在我看来,这是值得的)。

    arrows() 函数可以用来实现这一点。下面是一个如何使用该函数的简单示例:

    x <- stats::runif(12); y <- stats::rnorm(12)
    i <- order(x,y); x <- x[i]; y <- y[i]
    plot(x,y, main="arrows(.) and segments(.)")
    ## draw arrows from point to point :
    s <- seq(length(x)-1)
    arrows(x[s], y[s], x[s+1], y[s+1], col= 1:3)
    

    read "Drawing Diagrams with R" from the recent R Journal article

        3
  •  4
  •   Konrad Rudolph    16 年前

    PGF/TikZ

    很简单 example :

    \documentclass{article}
    \usepackage{tikz}
    \begin{document}
    
    \begin{tikzpicture}[scale=1.5]
        % Draw axes
        \draw [<->,thick] (0,2) node (yaxis) [above] {$y$}
            |- (3,0) node (xaxis) [right] {$x$};
        % Draw two intersecting lines
        \draw (0,0) coordinate (a_1) -- (2,1.8) coordinate (a_2);
        \draw (0,1.5) coordinate (b_1) -- (2.5,0) coordinate (b_2);
        % Calculate the intersection of the lines a_1 -- a_2 and b_1 -- b_2
        % and store the coordinate in c.
        \coordinate (c) at (intersection of a_1--a_2 and b_1--b_2);
        % Draw lines indicating intersection with y and x axis. Here we use
        % the perpendicular coordinate system
        \draw[dashed] (yaxis |- c) node[left] {$y'$}
            -| (xaxis -| c) node[below] {$x'$};
        % Draw a dot to indicate intersection point
        \fill[red] (c) circle (2pt);
    \end{tikzpicture}
    \end{document}
    

    tikz picture http://media.texample.net/tikz/examples/PNG/intersecting-lines.png

        4
  •  2
  •   Ludovico Fischer    16 年前

    matplotlib ; 它有很好的外观输出和处理最常见的数字图形类型。

        5
  •  2
  •   user44484 user44484    16 年前

    Scilab是Matlab的一个很好的开源版本,它具有绘图功能。两者都基于向量/矩阵的概念,可以在2D或3D中绘图

    此外,我过去使用Python/Numpy/Scipy和一些绘图(如matplotlib)库也没有受到影响,这为您提供了更多的库选项。

        6
  •  1
  •   user59634 user59634    16 年前

    除了建议的其他选项外,您可能还想尝试GNUOctave。您还可以考虑使用GNU科学库和与gnuplot的接口。

        7
  •  1
  •   user201028    16 年前

        8
  •  1
  •   Yaakov Belch    16 年前

    MetaPost:高质量图

    我曾经 MetaPost manual )在我自己的报纸上,我非常喜欢它。

    对于科学数据,这种基于文本的方法通常比图形用户界面更有效。您将不得不学习手册,但使用图像可以节省大量时间:使用GUI,您需要处理一些小细节,这些细节可以通过基于文本的方法一次性获得。

    杰格拉夫:快点,完成任务了吗

    JGraph ,另一个基于文本的绘图程序。它的学习和使用比MPost简单得多,但仍然可以创建非常好的绘图。对于程序生成的图形,我也经常使用jgraph:一个简单的perl脚本读取并处理我的输入数据,将一个简单的jgraph脚本写入一个图像,由jgraph处理。

        9
  •  0
  •   Jim Zajkowski    16 年前

    在Mac电脑上有 OmniGraphSketcher ,它的优点是不需要数字来制作教学图表。

    推荐文章