代码之家  ›  专栏  ›  技术社区  ›  stackinator Brenton Wiernik

在ggplot中具有相同面板大小的gridExtra面板打印

  •  0
  • stackinator Brenton Wiernik  · 技术社区  · 7 年前
    library(tidyverse)
    library(grid)
    df <- tibble(
      date = as.Date(40100:40129, origin = "1899-12-30"), 
      value = rnorm(30, 8)
      )
    
    p1 <- ggplot(df, aes(date, value)) + 
      geom_line() + 
      scale_x_date(date_breaks = "1 day") + 
      theme(
        axis.title.x = element_blank(), 
        axis.text.x = element_text(angle = 90, vjust = 0.5)
      ) + 
      coord_cartesian(xlim = c(min(df$date) + 0, max(df$date) - 0))
    
    p2 <- ggplot(df, aes(date, value)) + 
      geom_bar(stat = "identity") + 
      scale_x_date(date_breaks = "1 day") + 
      theme(
        axis.title.x = element_blank(), 
        axis.text.x = element_text(angle = 90, vjust = 0.5)
      ) + 
      coord_cartesian(xlim = c(min(df$date) + 0, max(df$date) - 0))
    

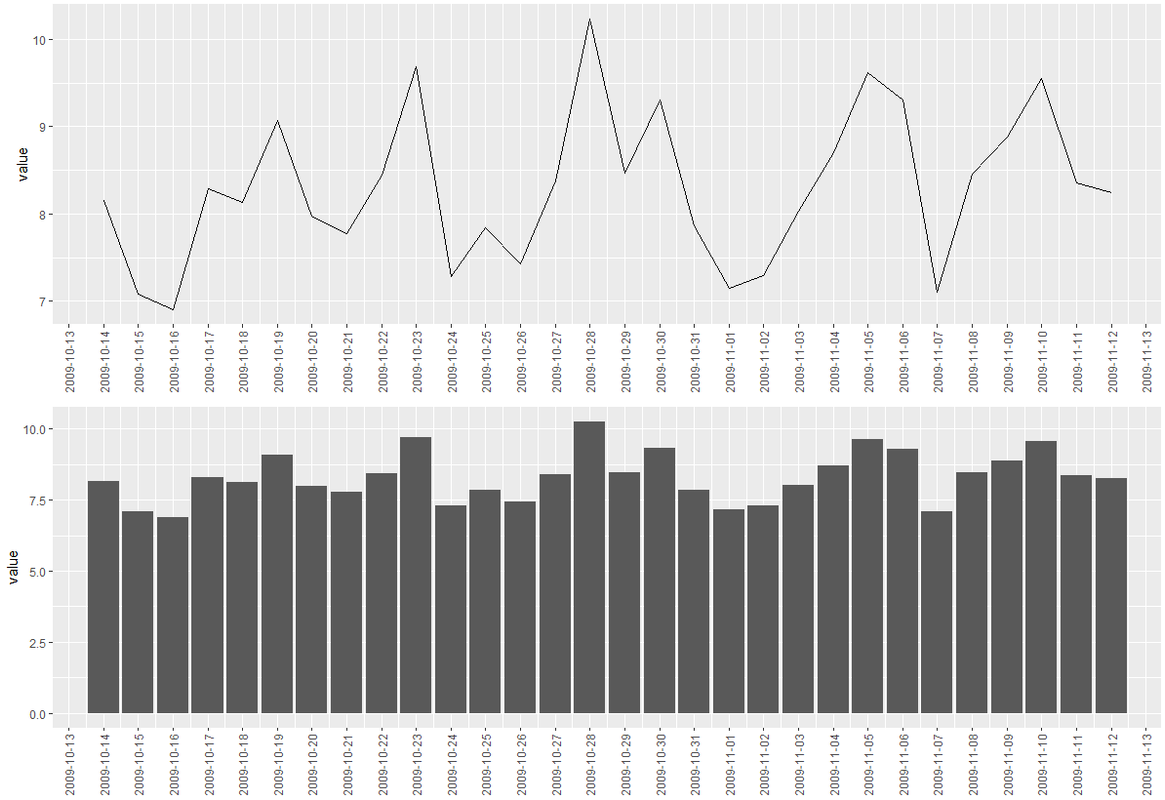
    让我们来创建情节 p1 如上图所示。我可以用完全相同的宽度(缩放到全屏以使其清晰可见)来绘制这些堆叠在一起的图像。注意日期排得很整齐。代码就在下面。

    grid.newpage()
    grid.draw(rbind(ggplotGrob(p1), ggplotGrob(p2), size = "last"))
    

    ggsave()

    gridExtra::grid.arrange(p1, p2)
    

    这几乎是可行的,但请注意日期并不是很完美地排列在一起,以垂直的方式比较顶部图形和底部图形。 所以。。。 相当于什么 rbind() size = "last" 给我拿两个 grid.arrange

    2 回复  |  直到 7 年前
        1
  •  1
  •   Jon Spring    7 年前

    作为替代 grid ,新的 patchwork

    https://github.com/thomasp85/patchwork

    patchwork::plot_layout(p1 / p2)
    

    enter image description here

        2
  •  0
  •   stackinator Brenton Wiernik    7 年前

    我用 egg ggplot2 . 我要走这条路,以防止安装 patchwork . 看来你需要R3.5+才能安装 拼凑 .

    egg::ggarrange(p1, p2)
    p <- egg::ggarrange(p1, p2)
    ggsave(plot = p, "panel-plot.png")
    

    Capture.png

    推荐文章